Appearance
Metrics
What is the Metrics page?
This page allows users to better understand operational usage by providing an overview of the operational state of AireFlow. This can be useful in a number of ways, including better understanding whether a workflow can be retired and seeing a summary of the number of tasks for a particular workflow at a glance.
Charts
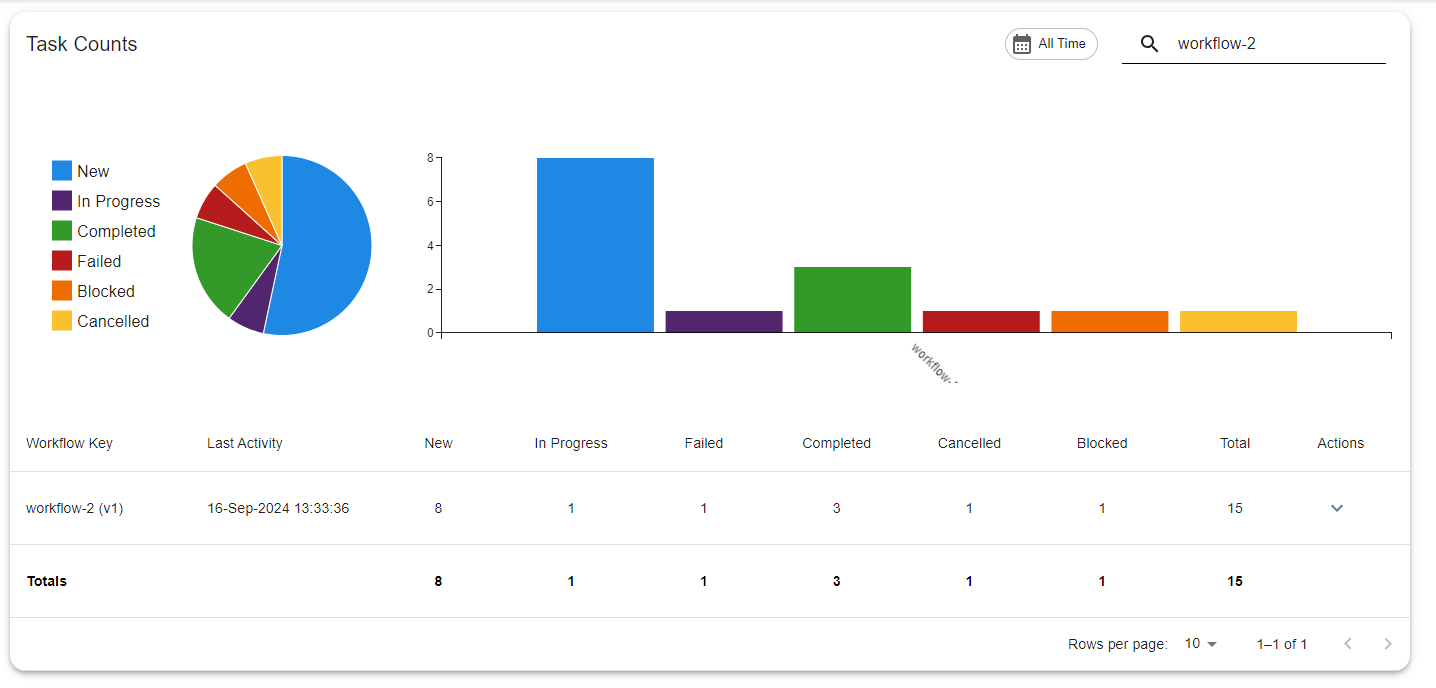
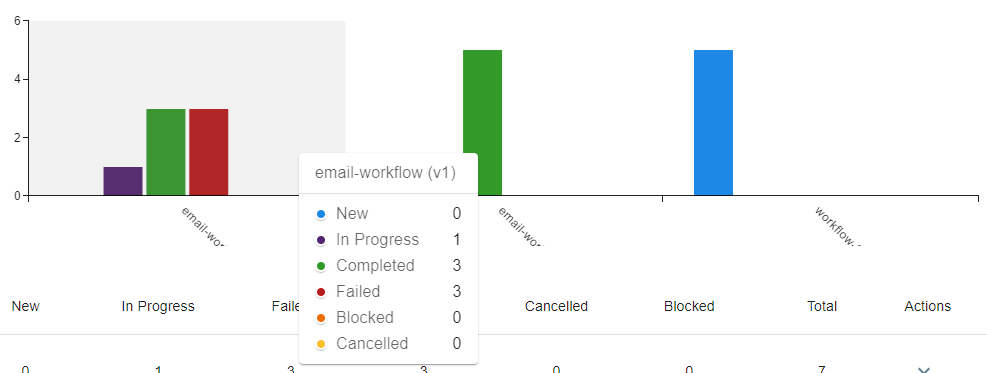
One of the charts displayed on this page includes a bar chart which is split up by workflow and then by the number of tasks for each status. Hovering over the graph will provide some further information including the full worklow key and a list of the status counts. The results shown in the bar chart will change depending on the search filter and date filters applied.
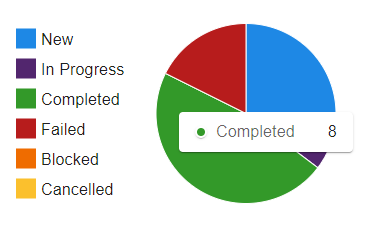
Secondly, there is a pie chart which shows a breakdown of all the task statuses across every workflow. If you hover over the pie chart you will see the actual number of tasks for that particular status. Again, this chart will be impacted by the filters selected at the top of the page.
Workflow Task Counts Table
This table shows a list of workflows with tasks that have been updated within the date range supplied by the date filter. The Last Activity column displays the date and time that the task was last updated. Each status column will display the number of tasks with that status for the associated workflow.
Provided you have the right access level, there may be an expand icon on the right hand side which allows you to view further task details.
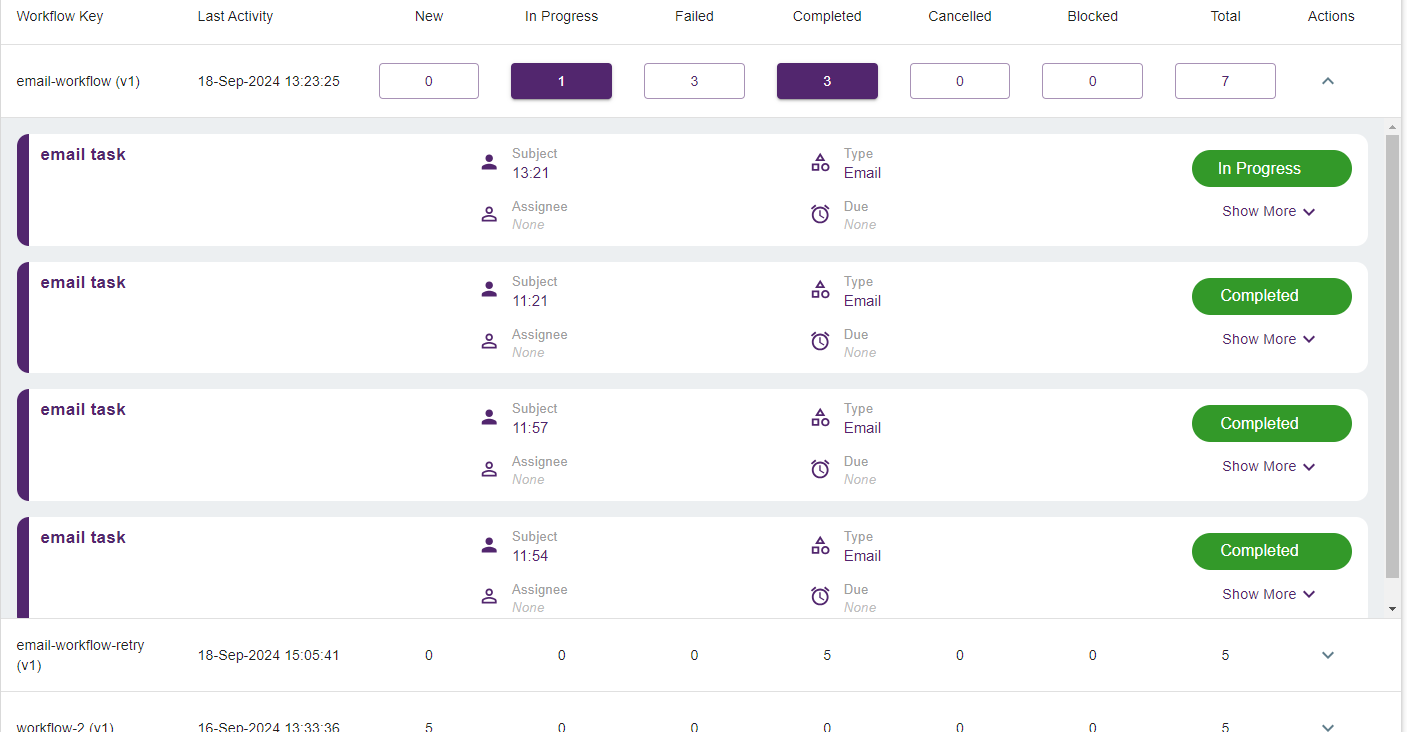
Here you can click on the status buttons to filter the list to one or more statuses so that only those tasks are displayed in the view. You can also make amendments to tasks in the same way you can on the Tasks page
The final row in the workflow task counts table is the Totals row which shows the sum of each status in the list. This is impacted by the filters you supply.
Filters
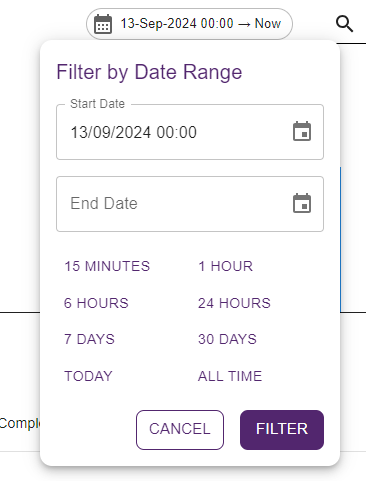
When loading the page, the default filter applied is to only display the tasks that have been created/updated within the past week. However, if you want to amend the date filter you can click on the date filter box and a dialog will appear. Here you will be able to select some of the pre-set options e.g. 1 hour, 24 hours, 30 days or have more fine grained control by selecting the start and/or end date fields.
Another way to filter the results is with the search box, here you can begin typing in a desired workflow key or last activity date. Any results matching/partially matching this value will appear in the charts and table.